Creating a COVID-19 dashboard with Django & ChartJS
In this article, we will create a COVID-19 dashboard using the Django Framework in Python.
We will use some API to fetch data on active, confirmed, recovered, and deceased cases and try to answer questions like:
- How does the National Spread of the virus look like?
- How intensive the spread of the virus has been in the States?
Here we are using ChartJS to plot some useful and intuitive graphs to answer these questions. In this blog, I’ll take you through the complete process I have followed to create the dashboard.
Steps
- Project setup
- Create models to save data to the database.
- Load data to the database table from COVID-19 APIs using management commands
- Create a home page with a date filter dropdown and a list of states' case counts based on the date we select(here we are using bootstrap templates).
- Show a bar graph based on the date selected from the dropdown by using ChartJS
- Create a state page and show a bar graph of the top 5 districts'## active count with the latest date and latest data.
- Create a search page
1.Project setup
Create a new project directory and virtual environment, activate the environment, install Django and start a new Django project and create a Django app. Pipenv is used to manage python packages and virtual environment, refer Pipenv and virtual environment.
$ mkdir covid_dataproject
$ cd covid_dashboard
$ pipenv install django==3.1.5
$ pipenv shell
(venv) $ django-admin startproject coviddata .
(venv) $ python manage.py startapp dashboard
Create a new app dashboard in your Django project and register it in the project settings.
(venv) $ python manage.py startapp dashboard
INSTALLED_APPS = [
    ...
    'dashboard.apps.DashboardConfig',
]
To make sure everything works until that point, start the development server and go to http://127.0.0.1:8000 in your browser.
(venv)$ python manage.py runserver
2.Create models to save data
#model.py
from django.db import models


class CovidDistrict(models.Model):
    state = models.CharField(max_length=100)
    district= models.CharField(max_length=100)
    active= models.IntegerField()
    confirmed = models.IntegerField()
    deceased = models.IntegerField()
    recovered = models.IntegerField()
    published_date=models.DateField(auto_now_add=True)

   def __str__(self):
        return self.state
Here we create a database table CovidDistrict and columns such as state, district, active, confirmed, deceased, recovered, and published_date. Published_date field is more useful to do filtering based on Date.
The __str__() method will return the state name.
(venv) $ python manage.py makemigrations dashboard
(venv) $ python manage.py migrate
on migration python file is converted into a database.
You can add model to the Django admin as follows:
#admin.py
from django.contrib import admin
from .models import CovidDistrict

admin.site.register(CovidDistrict)
3. Load data to the database from COVID-19 APIs using management commands
One way to import the data would be to open a Django shell python manage.py shelland write a few lines of code that parse the JSON file, create the CovidDistrict objects and write and save them to the database.
Therefore it would make sense to create a custom Django-admin command. This command can be efficiently run from the command line or set up as a scheduled job and periodically run.
Create a folder named management in our Django app, and make a subfolder named commands and create a python file named as same as the command to be executed. refer
The following would be the management command to read the API and populate the model.
#dashboard>management>commands>fetch_covid_data.py

from django.core.management.base import BaseCommand
from django.db.models.fields import DateField
from dashboard.models import CovidDistrict
import requests
import json


class Command(BaseCommand):
    help = 'fetch_covid_data'

    def handle(self, *args, **kwargs):

        url="https://api.covid19india.org/state_district_wise.json"
        response=requests.get(url).text
        response_info=json.loads(response)

        for state, state_data in response_info.items():
            district_info =state_data['districtData']

            for district_name,district_values in district_info.items():
      obj1=CovidDistrict.objects.create(state=state,district=district_name,active=district_values['active'],confirmed=district_values['confirmed'],deceased=district_values['deceased'],recovered=district_values['recovered'])
                obj1.save()
Here we are creating a command class and method handle for the management command execution, importing the JSON module (the JSON module is used to convert the python dictionary above into a JSON string that can be written into a file. While the JSON module will convert strings to Python datatypes). Data is taken from the URL="api.covid19india.org/state_district_wise.json". We will be using the requests module to fetch the API.
(venv) $ pipenv install requests
From the above refer section python management command -we know that loads() will convert JSON data to a python dictionary. By looping, we get the required data to add the database. with the help of create() and save() methods.
we can load the data from the COVID-19 API to our database with the following command:
(venv) $ python manage.py fetch_covid_data
Create a home page with a date filter dropdown and a list of states with covid case counts based on the date we select(here we are using bootstrap templates).
First, we have to create a template folder in the project directory and make a common base.html layout that will use Bootstrap 4. And we will use this layout across our project.
#dashboard/home.html
{% extends 'layouts/base.html' %}
{% block content %}

<div class="starter-template">
        <h1>Bootstrap starter template</h1>

        <p class="lead">Use this document as a way to quickly start any new project.<br> All you get is this text and a mostly barebones HTML document.</p>
      </div>

{% endblock content %}
Here we have the homepage inherited from the base layout base.html.
Also, we need to make changes in settings.py, for Django to read templates from the templates folder.
#settings.py
Templates=[
...........
 'DIRS': [os.path.join(BASE_DIR, 'templates')]
...........
]
4. Dashboard Home, with date filters
First, we need a urls.py file for the project, as follows:
#covid_data/urls.py
from django.contrib import admin
from django.urls import path, include


urlpatterns = [
path('admin/', admin.site.urls),
path('', include('dashboard.urls')),
]
Here the include function will direct to the app level URLs. Next, make a urls.py file within the app directory.
from django.urls import path
from .views import DateFilterView


urlpatterns = [
path('  ', DateFilterView.as_view(), name='case'),

]
For the view, we will fetch the data from the database based on the date we fetch the data from the database based on the date we select (or the latest date by default if no date is selected). The queryset is passed to the context as a keyword argument. Now we will create separate functions for fetching data for the following:
get_published_dates() - for fetching all distinct dates from our data
get_latest_date() - for fetching the latest data that we have data for
get_state_data(pub_date) - to fetch the state data summary
#views.py
def get_state_data(pub_date):
    state_total_data=CovidDistrict.objects.filter(published_date=pub_date)
.values('state').annotate(Sum('active'),Sum('confirmed'),Sum('recovered'),Sum('deceased'))
    return state_total_data
The get_state_data() method returns a list of states, the total count of active, confirmed, deceased, and recovered cases based on the argument passed at the function call. Here we used the annotate function and the Sum aggregate function from Django ORM to get the required data efficiently.
Note that, the globally defined functions can be accessible at all the classes.
Now, we have to create a class-based view like this as follows:
#views.py


class DateFilterView(View):
    model=CovidDistrict
    template_name='core_section/home.html'
    def get(self,request,*args,**kwargs):

        all_dates=get_published_dates()
        latest_date=get_latest_date()
        state_total_data=get_state_data(latest_date)

        context={
            "all_dates":all_dates,
            "latest_date":latest_date,
            "state_total_data":state_total_data

        }
        return render(request,self.template_name,context)
In the get method, we are calling the previously defined functions and assigning them to variables. By default when the page loads we will use the latest date to show the latest data, we have in the dashboard.
#views.py

 all_dates=get_published_dates()
 latest_date=get_latest_dates()
 state_total_data=get_state_data(latest_date)
For the date filter, we need to create a form. Here we are creating a form. We will have the date filter as a dropdown. Refer to dashboard/home.html template.
From this home page, we can select a date from the dropdown. On submission, the POST method will be called, so we have to write a post() function for the further steps.
#views.py

def post(self,request,*args,**kwargs):
        published_date=request.POST.get('published_date')
        query_date = datetime.strptime(published_date, '%B %d, %Y')
        state_total_data=get_state_data(query_date)
        all_dates=get_published_dates()


        context={

            "state_total_data":state_total_data,
            "all_dates":all_dates

        }
        return render(request,self.template_name,context)
On submitting the form we get the published date as request object. 'published _date' is the name which we are given in the form on the home.html page.
query_date = datetime.strptime(published_date, '%B %d, %Y')
the above code will help to convert the string format to datetime object.
And we pass the date, to the get_state_data() function to get the data for the selected date.
The resulting data is displayed in a table as follows (refer dashboard/home.html):
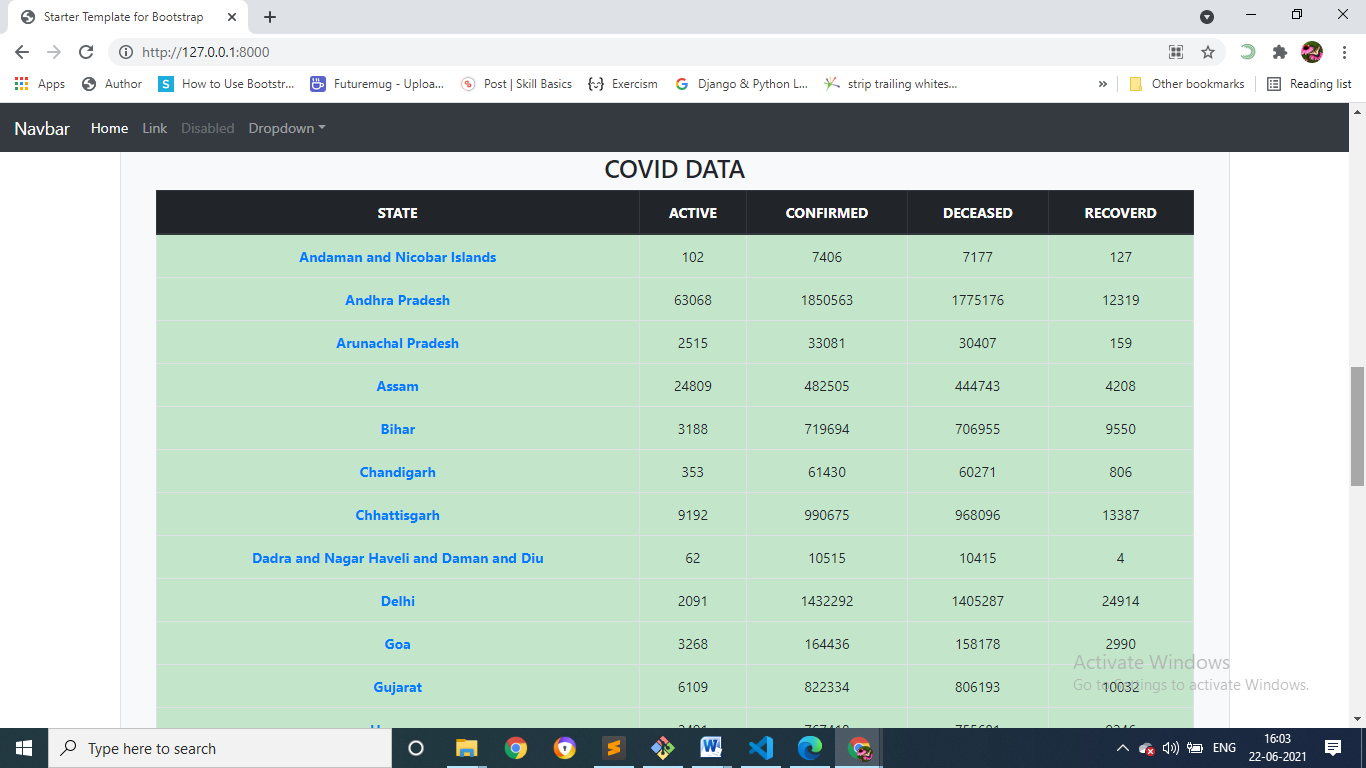
if we are not select selecting any date options manually, we get the latest date as published_date and the latest data in the state list.
5.Display a bar chart with ChartJS
We will use ChartJs to plot bar graphs based on the data from the database.
We will include the library with a CDN link
#base.html
<!--Chart js-->
        <script src="https://cdnjs.cloudflare.com/ajax/libs/Chart.js/2.8.0/Chart.min.js" integrity="sha256-Uv9BNBucvCPipKQ2NS9wYpJmi8DTOEfTA/nH2aoJALw=" crossorigin="anonymous"></script>
we need to have a canvas on our page for responsiveness.
#home.html
<div>
  <canvas id="myChart"></canvas>
</div>
now we can create a chart. We add a script to our page:
const config = {
  type: 'bar',
  data,
  options: {}
};
#setup
data: {
      labels: [{% for total in state_total_data %}'{{total.state}}',{% endfor %}],
  datasets: [
    {
      label: "active",

      backgroundColor: "green",
      data: [{% for total in state_total_data %}'{{total.active__sum}}', {% endfor %}]

        },
  {
    label: "confirmed",

      backgroundColor: "red",
        data: [{% for total in state_total_data %} '{{total.confirmed__sum}}', {% endfor %}],

        },
  {
    label: "recovered",

      backgroundColor: "blue",
        data: [{% for total in state_total_data %} '{{total.recovered__sum}}', {% endfor %}] ,

          },
  {
    label: "deceased",

      backgroundColor: "black",
        data: [{% for total in state_total_data %} '{{total.deceased__sum}}', {% endfor %}] ,

        }
        ]
      },
  options: {
    scales: {
      y: {
        beginAtZero: true
      }
    }
  }
Finally, render the chart using our configuration:
// === include 'setup' then 'config' above ===
<script>
var myChart = new Chart(
document.getElementById('myChart'),
config
);
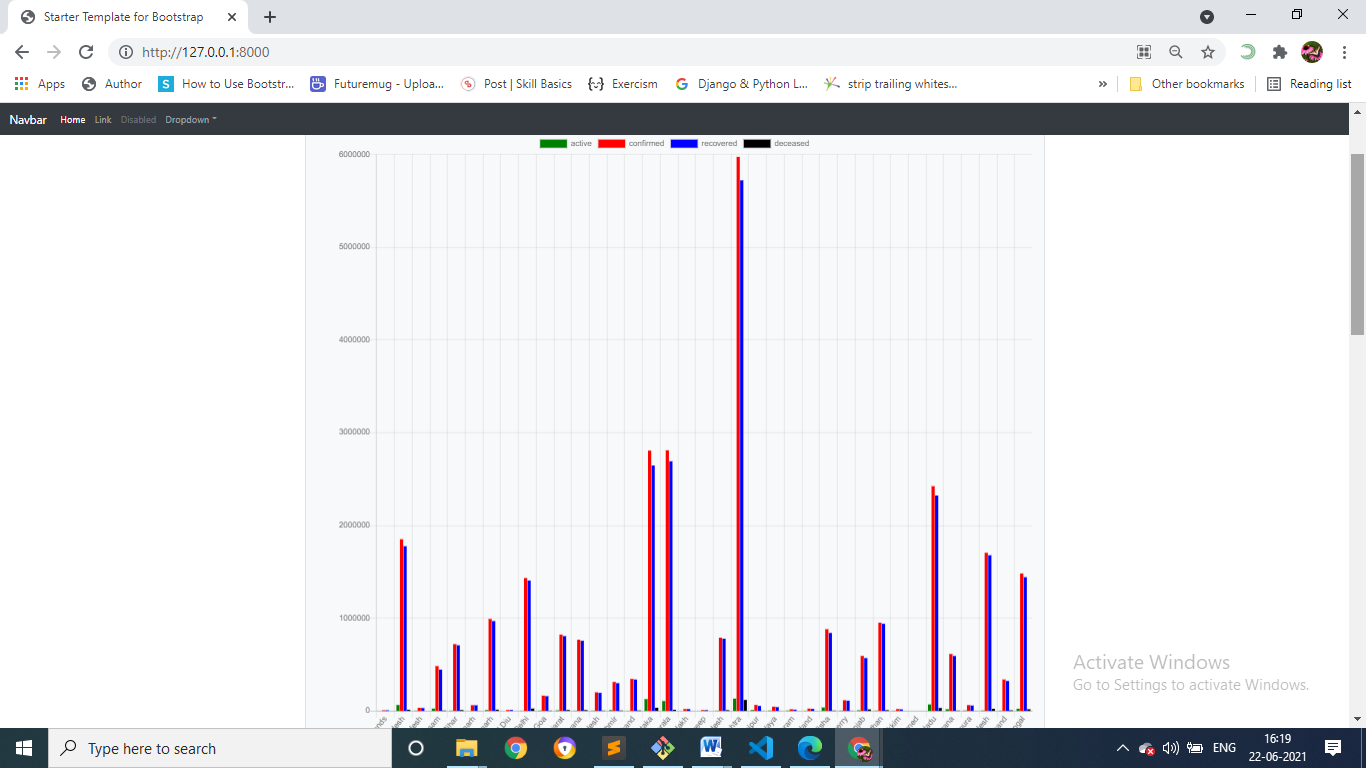
</script>
we get a bar chart like this ( all the total counts of all the states).
We also create a page with URL /top/active showing a list of top 10 districts ordered by active cases descending across all states with the latest date. We will use the following query to fetch the data:
ordered_districts=CovidDistrict.objects.filter(published_date=latest_date).order_by(
'-active').values('state','district','active')[:10]
Refer to ActiveCasesView for more details.
6.State Dashboard Page
The next task to be done, Create a state page and show a bar graph of the top 5 districts' active count based on the date from the dropdown or latest date.
#urls.py
from django.urls import path
from .views import StateView

urlpatterns = [
path('path('state_dashboard',StateView.as_view(),name='state')',

]
#views.py
class StateView(View):
    model=CovidDistrict
    Template_name="core_section/state_page.html"
    def get(self,request,*args,**kwargs):
        latest_date=get_latest_date()
        state_covid=request.GET.get("state")

        state_covid_data=CovidDistrict.objects.filter(state=state_covid,published_date=latest_date)
.order_by('-active').values('state','district','active')[:5]

        context={
            "state_covid_data":state_covid_data,
            "latest_date":latest_date

        }

        return render(request,self.template_name,context)
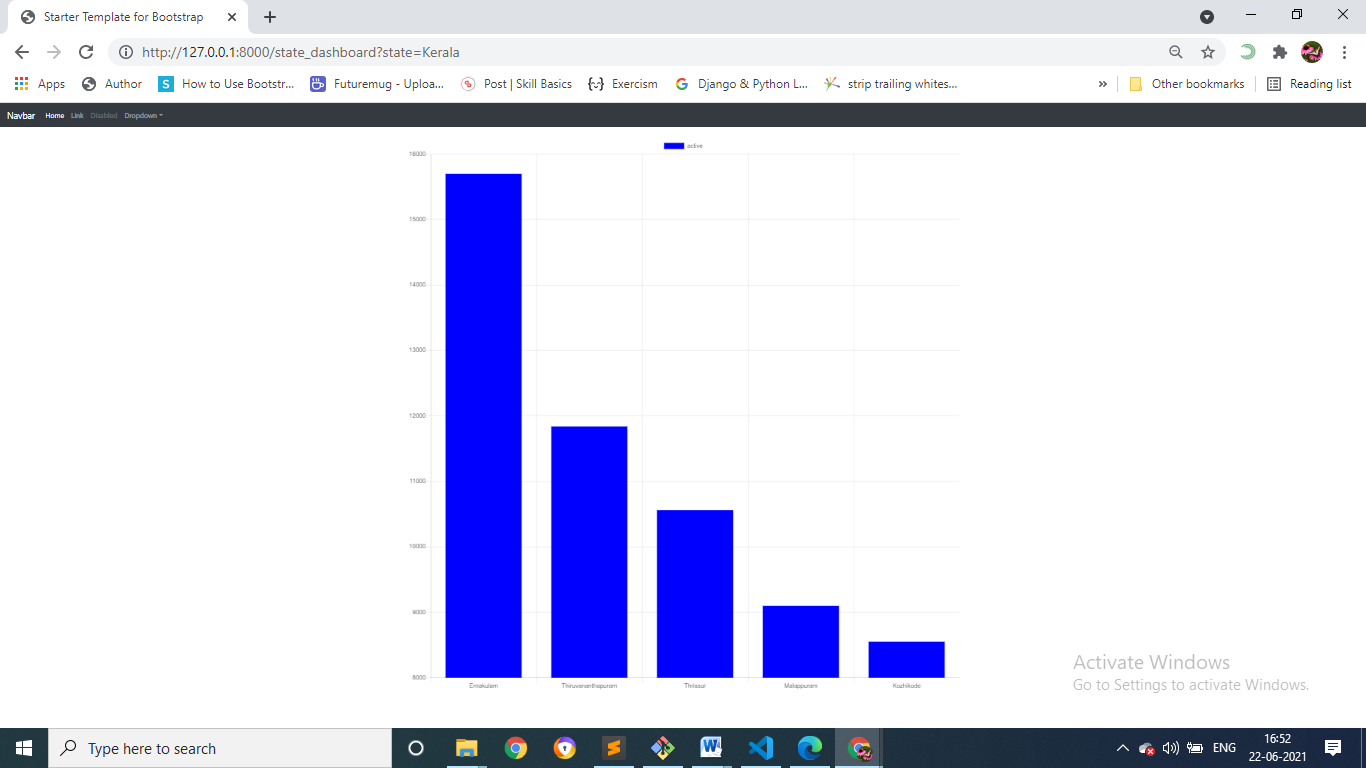
(bar graphs are the same as that we discussed above. refer - chart.js)
The page shows the district-wise active cases as a bar graph. the top 5 active districts active cases-graph as follows:
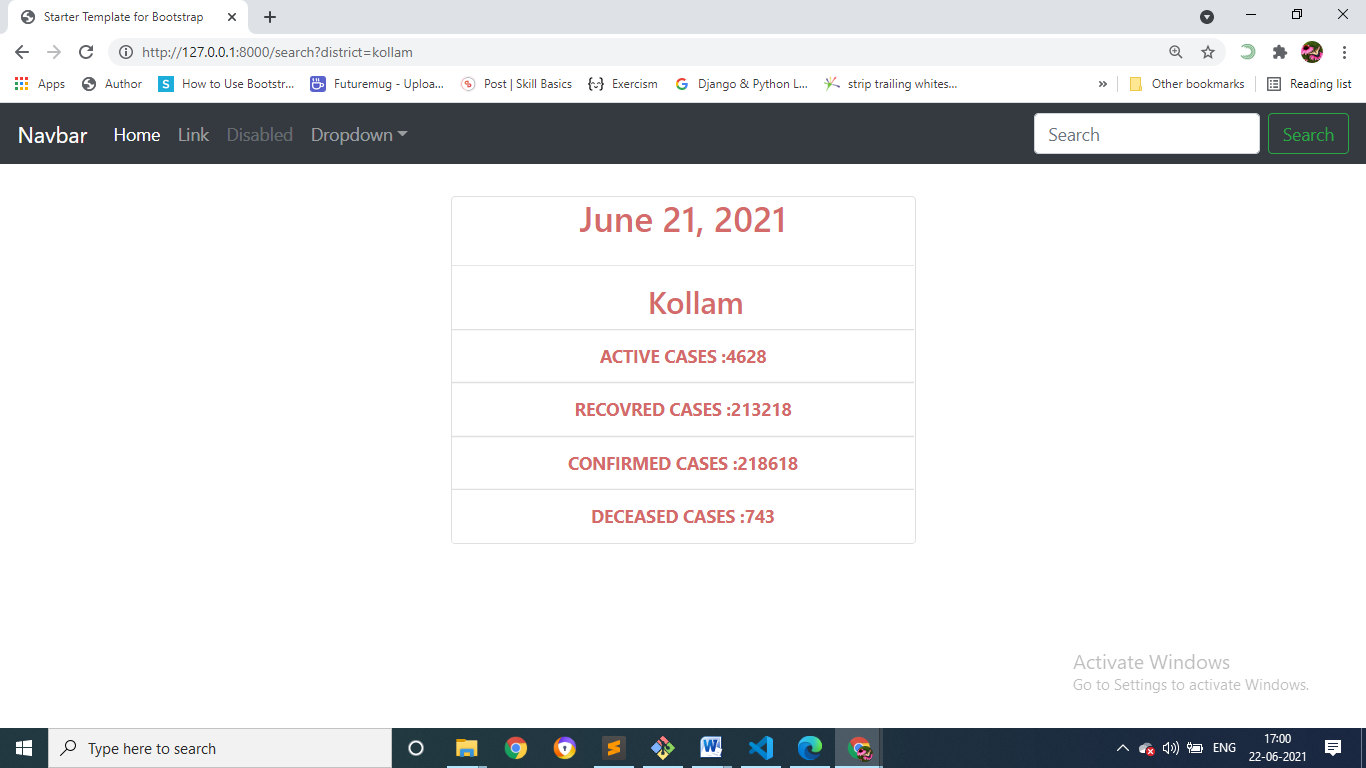
7.Search Page
The search page will take a district name as input, and on submit show the [Active, Confirmed, Deceased, Recovered] cases of that district based on the latest date updates. If the district is not found, We display, "District not found." in urls.py
#urls.py
from django.urls import path
from .views import SearchView

urlpatterns = [
path('search',SearchView.as_view(),name='search')

]
#views.py
class SearchView(View):
    model=CovidDistrict
    template_name='core_section/search.html'
    def get(self,request,*args,**kwargs):
        latest_date=get_latest_dates()

        val = self.request.GET.get("district")

        if val:
            queryset = CovidDistrict.objects.filter(district__iexact=val,published_date=latest_date).values('state','district','active','confirmed','recovered','deceased','published_date').order_by('-published_date')
            print("query set:",queryset)
        else:
            queryset=None
     context={
                "queryset":queryset,
               "val":val

        }
        return render(request,"core_section/search.html",context)
here we added the search form on serach.html, on submitting the form the SerchView will work ....
#search.html
<form class="form-inline my-2 my-lg-0" action="{% url 'search' %}" method="GET">
          <input class="form-control mr-sm-2" type="text" placeholder="Search" aria-label="Search" name="district">
          <button class="btn btn-outline-success my-2 my-sm-0" type="submit">Search</button>
        </form>
display the search result on the search.html page template.
If there are search results, the output looks like this:
Conclusion
So, in this article we saw how to create a Django project to display a dashboard. Populated the database by fetching data using an API with Django management command. We looked at how we fetch the data using the ORM for the various dashboards, and showed charts using ChartJS. I hope you found this article useful.
You can find the full code for this project at
https://github.com/atheenaantonyt9689/covid19_data_project
Thanks for reading.